

.
This page contains a sampling of the analytical graphics & visualizations (“infographics”) that I’ve designed for the following applications:
(1) Litigation
(2) Corporate & Advertising
(3) Civic activism
(4) Political media
Also see my Storyboarding Porftolio, which features summaries of ten animation sequences that I designed and/or directed the production of, mostly earlier in my career, for advertising, corporate, and educational media. My demo reel:
(1) Litigation
Since 2000, I have periodically consulted on and designed media tools for high-value and complex litigation. See my complete Litigation Media Portfolio for detailed case studies, and read client testimonials here. Here are a few cases on which I worked:
(1.1) Land-use dispute over proposed $100 million condominium tower
(1.2) Wrongful death case vs. Ford Motor Co.
(1.3) $800k Property damage claim
(1.1) Land-use dispute over proposed $100 million condominium tower
This is part of a larger presentation I created that my client, a property developer, claimed was vital in helping it to resolve, in its favor, a multi-year battle over its proposal for a $100 million beachfront condominium tower in Ft. Lauderdale, FL. This presentation also served as the basis of my client’s successful multi-million dollar lawsuit, that was settled out of court with the defendants’ insurance companies.
See the complete project profile here.
(1.2) Wrongful death case vs. Ford Motor Co.
I created these analytical graphics for a courtroom presentation that successfully demonstrated how a faulty speed-control cable malfunctioned, leading to a man’s death.
See the complete project profile here.
$800k Property Damage Claim
This was one of a series of 2D and 3D analytical graphics & visualizations that I designed, to help a Virginia law firm demonstrate to a jury that contractors’ negligence led to a woman’s home & art studio exploding and burning to the ground. According to the law firm, these tools were vital in achieving an out-of-court settlement with all three of the defendants’ insurance companies.
See the complete project profile here.
 .
.
(2) Corporate & Advertising
(2.1) Market share growth
(2.2) Software performance metrics
(2.3) Publishing
(2.4) Media usage research
(2.1) Market share growth
An infographic to help a Charlottesville, VA home builder explain its growth in market share, for its business plan. This was part of an eight-month consulting project to help position the builder to win the most prestigious national award in its industry. It won, and credited my work with being a big contributing factor.
See complete project profile here.

(2.2) Software performance metrics
An infographic to explain a new Website user experience measurement system. See complete project profile here.

(2.3) Publishing
An infographic to explain what makes a new magazine I created, the Galt Ocean Mile INSIDER, so different from, and better than its competitors — particularly regarding the fact that it micro-targeted a most-desired beachfront community. See the brochure that contains this infographic here.
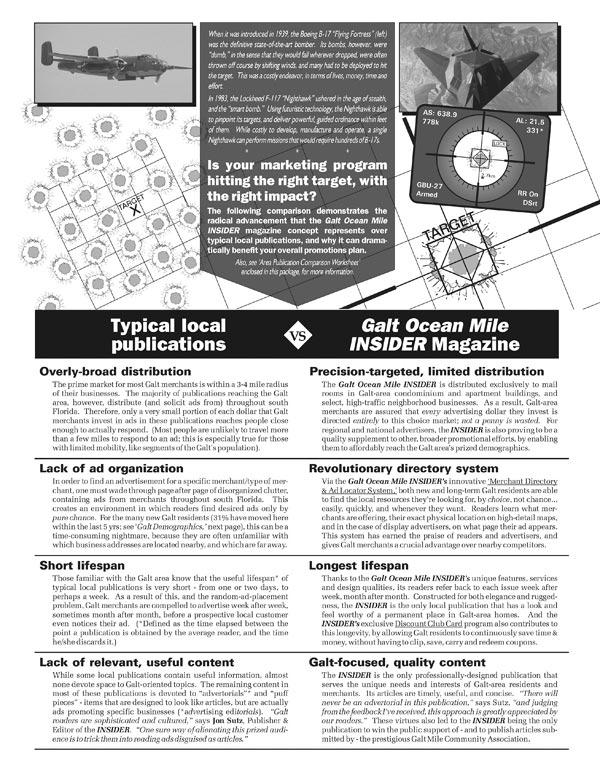
A related infographic to explain why the Galt Ocean Mile INSIDER provided superior dollar-for-dollar advertising value than its rivals. Details here.

(2.4) Media usage research
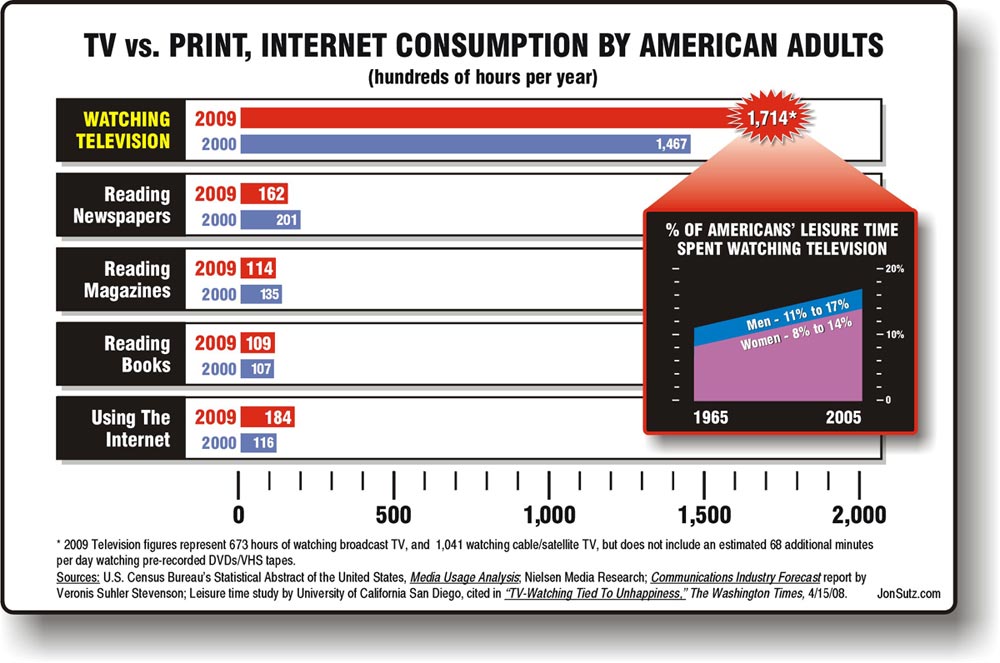
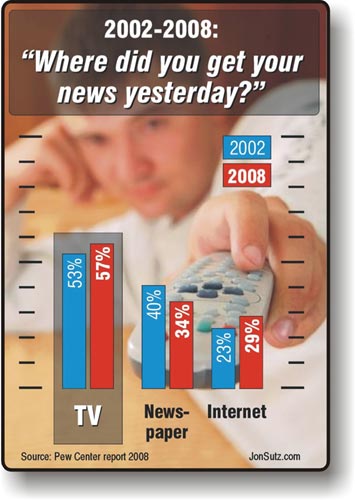
I researched and compiled key data to create thes infographics (2010) for a personal project, to depict the fact that while the Internet was rising as a news source, TV still dominated. More here.
(3) Civic Activism
(3.1) HeatKills.org
(3.2) Entitlements Destroy Lives
(3.1) HeatKills.us
I created the HeatKills project in 2013-2014 to pursue one mission: to help prevent dogs from suffering in hot cars. It was born out of my shock at seeing numerous incidents of people leaving dogs in hot cars, and how difficult it was to find reliable information about the heatstroke danger to dogs. I decided to put my activism and media skills to work, to create a means of raising awareness of this danger, that presented core information in a format so simple that even a child could quickly grasp it, and validate claims as accurate.
One key aspect of my work was to find a way to consolidate scientific data about how quickly the temperature inside a hot car can rise, even if its windows are cracked. Using source data from San Francisco State University, I created this infographic to serve as a central fixture of the project, and downloadable-printable flyers that will help combat this phenomenon:
 I built the original version of the site, HeatKills.org, in 2013-14 (archive here). It rapidly became a highly-respected and widely-cited online resource that focused specifically on the issue of heatstroke and dogs. See examples of how widely HeatKills.org was cited, and used by dog lovers throughout America and beyond, here.
Here is an infographic slide show I created, that is designed to take the average person from unawareness to fluency on basic dog physiology, how quickly the interior temperature of a car rises, even with the windows partially open, and examples from around the world of how widespread the problem of dogs being left in hot cars has become:
HEATKILLS.us HEATSTROKE EDUCATION SLIDE SHOW 2023 by Jon Sutz from JonSutz
Unfortunately, as I describe here, all that I’d accomplished with HeatKills.org was destroyed, through a tragedy that was beyond my control. The core data was still intact, but the HeatKills.org domain – and all to which it was attached – was wrecked, by the negligence of one of America’s largest domain registrars. It is the subject of upcoming litigation.
This is why I had to rebuild everything at a new domain, HeatKills.us.
The entire project is dedicated to the loving memory of Shayna, the “miracle dog” I was fortunate enough to adopt soon after the 9/11 attacks, who ended up transforming my life. Learn about her, and our life together, here.

(3.2) Entitlements Destroy Lives
Entitlements Destroy Lives (EDL) was a 501(c)3 nonprofit that was dedicated to raising awareness of, and combating the belief that some people will never be able to achieve self-sufficiency, and thus, must rely on others, including government, to provide what they need and desire. Often, this belief is instilled in certain people based on their race.
I was retained by the EDL project’s founder, Jim Morris, to help write its business plan, develop its website, and work with him to create the site’s core content.
Learn about my work on the EDL project at:
Entitlements Destroy Lives – Jon Sutz
Unfortunately, Jim was stricken with numerous illnesses, after which its domain was not renewed (here is an archive version of the site), and EDL as an organization is now in stasis. Here, however, is what Jim had to say about the value that I brought to the project:
“Jon has been tremendously important to the Entitlements Destroy Lives project. Through his graphic design and writing abilities, Jon has been able to convey EDL’s core message in a very coherent and persuasive way. I would strongly recommend Jon to anyone who has a project that needs this kind of clarity brought to it.”
– Jim Morris, Founder & President
Below are a few examples of poster art items that I conceived of and produced, to consolidate EDL’s mission – in a way that propels forth one of the tactics that I advocated from my earliest days as a consultant to EDL: putting entitlements advocates on the moral defense:


I also designed and produced this infographic slide show for EDL, that depicts the fact that:
(a) When paid-in entitlements (eg Social Security) are removed, half of all federal spending is devoted to welfare entitlement giveaway programs
(b) The U.S. government is borrowing every cent of the cost of these programs, every year
(4) Political Media
In recent years, much of my infographics work has been devoted to advocacy-type media. See my Advocacy Media Portfolio for detailed case studies and client testimonials. Following is some of this work. Other items are viewable only after interested parties complete my confidentiality agreement.
(4.1) Analysis of President Trump’s $5 billion border security funding request — and deeper, unreported issues
(4.2) Key facts & questions regarding the “caravans”
(4.3) Is it true that many of the marchers in the “caravans” are women & children?
(4.4) Hate crimes in America
(4.5) Virginia property tax reform proposal – key infographics
(4.6) Key infographic to debunk anti-Israel libel that was spread by world “news” media
(4.7) Infographic slide show to help a Virginia home builders association to combat arbitrary county land use decisions
(4.8) Civic perceptions and literacy
(4.9) Surveys regarding perceptions of Israel and Jews
(4.10) Policy proposal slide shows re the US economic, national security and cultural issues
(4.1) Analysis of President Trump’s $5 billion border security funding request — and deeper, unreported issues
I became extremely frustrated when an array of politicians in Congress, in conjunction with major swaths of the “news” media, began insisting in late 2018 that there was no crisis at the U.S. southern border, that walls “are an immorality,” and that there was no need to spend $5 billion on physical border security.
From 2013-2020 I was the consulting editor and videographer for SaveTheWest.com. I had been researching this issue deeply, and decided to compile the most essential aspects of this research into a simple, 10-frame infographic slide show, that would link back to a comprehensive database to prove my assertions. See my report here, and the slide show, below:
Nine vital numbers regarding President Trump’s $5 billion funding request for the border wall that every American should know, by SaveTheWest.com from JonSutzSTW
More of my work for SaveTheWest (STW) follows.
(4.2) Key facts & questions regarding the “caravans”
During the height of the controversy over the “caravans” of tens of thousands of people marching from Central and South America o the U.S. border, I recognized that the American “news” media and political figures were (1) Spreading demonstrable lies about the issue, and (2) Egregiously negligent in failing to point out very basic facts, in a format that a child can understand.
As part of my broader efforts to create a comprehensive report, “Who benefits from the lies being spread about the ‘caravans’?,” I researched and developed this infographic slide show to present these basic facts, for STW:
Key facts & questions regarding the “caravans” from JonSutzSTW
(4.3) Is it true that many of the marchers in the “caravans” are women & children?
Continuing from (4.1) and (4.2), another way Americans were misled regarding the composition of the “caravan” marchers, was that the overwhelming majority were women & children — as a pretext upon which to accept all, with no or only minimal screening. Independent journalists outside the mainstream media, however, posted various evidence that the overwhelming majority of marchers were, in fact, military-age males. This fact lent strong support to my major report, “Who benefits from the lies being spread about the ‘caravans’?,” that demonstrated that among these marchers were repeatedly-deported criminal illegal aliens, MS-13 gang members, woman & child sex traffickers, and in all likelihood, Islamist terrorists & terror supporters.
In order to expose this facet of the “news” media’s and certain politicians’ lies, and how they are constructed, I created this slide show.
(4.4) Hate crimes in America
Since the 9/11 attacks, there has been a persistent perception that Muslims in America are at extraordinarily high risk of being the victims of hate crimes. But is it true?
I researched and produced this infographic report to present the truth about hate crimes in America — that Muslims are among the least-frequent victims of hate crimes, while Jews are far & away the most-frequent. Properly utilized, it will help to facilitate a fact-based discussion about the issue, and expose those who are spreading incendiary lies about it. The full report is here.
STW Hate Crimes Report 25July15 Final from JonSutzSTW
(4.5) Virginia property tax reform proposal – key infographics
I donated my creative and design services to a nonprofit group, Virginians Over-Taxed On Residences (VOTORS), that had drafted model legislation to help prevent poor and fixed-income Virginia homeowners from being taxed out of their homes, through ever-increasing property taxes. By its own admission, its promotional materials were not well designed and were not effective, especially at attracting a broad coalition of support among low-and fixed-income Virginians, many of whom had limited literacy skills.
After analyzing the proposal, and the audience, I created these infographics to explain (1) how, despite real wage fluctuations, property taxes in Virginia kept dramatically rising, and (2) how this group’s proposal would dramatically limit these increases, to help prevent poor and fixed-income homeowners from being taxed out of their homes. See complete project profile, and client testimonial, here.

(4.6) Key infographic to debunk anti-Israel libel that was spread by world “news” media
I researched and developed this infographic to help the State of Israel and the Israel Defense Forces (IDF) to obliterate the lie that major world “news” organizations were spreading, as to how a beloved Israeli military officer was killed in a cross-border firefight. See the complete project profile here.

(4.7) Infographic slide show to help a Virginia home builders association to combat arbitrary county land use decisions
This infographic was part of a slide show I created to help the Blue Ridge Home Builders Association (BRHBA) to educate local governments about how arbitrary land use policies affect the bottom-line pricing of new housing. See the complete project profile here.

(4.8) Civic perceptions and literacy
I created these infographics to supplement a comprehensive research report I produced that indicates how far American culture has drifted (I would argue, has been driven) away from an understanding and appreciation of liberty, and of our Constitution’s framework for a federal government with narrow, limited powers.
See my updated report: “America At The Precipice” – A special report by Jon Sutz.


(4.9) Surveys regarding perceptions of Israel and Jews
A key slide show from my new ILoveIsrael project:
(4.10) Policy proposal slide shows
This was a segment of a larger infographic slide show that I created for SaveTheWest . The purpose of these slide shows was to help my client, the founder of STW, to make personal presentations to policy makers at the federal and state level, containg recommendations for how to address America’s biggest national security, economic and cultural challenges.
One of my key missions was to establish a design standard that would clearly distinguish these slide shows from others in the policy realms, and to make viewing them a pleasure. Each slide show segment uses the same visual standard, but the key colors change to distinguish one from another (see other portions of the slide show I created here and here).
.
.
.